
What to watch coming out
of the U.S. midterms
Published October 2026
Americans head to the polls on November 3 in a sour mood. Surveys show that Democrats and Republicans alike are unhappy with how Washington is performing, and that frustration has built across several administrations, not just this one. Two issues have weighed most heavily on the current leadership, however: inflation and the war in Iran, which are President Trump’s weakest issues in recent polling.
History does not favor the president’s party. Since 1962, the party in the White House has lost an average of roughly 22 House seats and two Senate seats in midterm elections. In 2018, with President Trump’s approval rating around 39%, Republicans lost 41 House seats.1 With Trump’s approval rating again near 39% at the end of September, and Democrats needing to gain only four seats to retake the House, even half of the 2018 loss would easily flip the chamber.
Markets have priced in a Democratic House, but not a sweep
In our view, markets have fully priced in a Democratic House. We are less confident that the S&P 500 Index is priced for a “blue wave,” with Democrats taking both chambers of Congress. The administration has been strongly pro-business, particularly on taxes and deregulation, and a sweep would likely unsettle stocks at first.
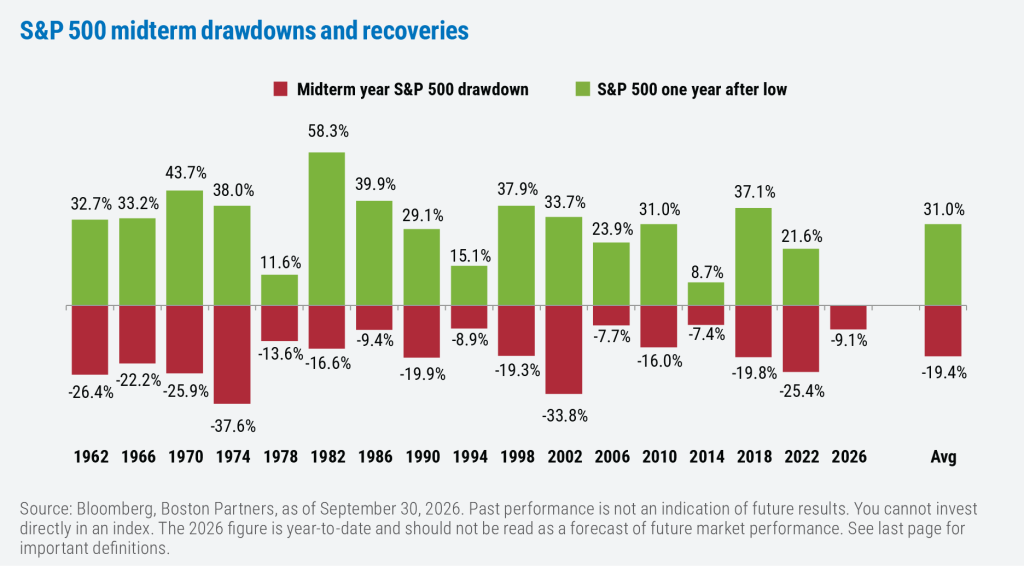
History offers some useful perspective. Since 1962, the S&P has experienced an average drawdown of about 19% in midterm years. We already saw a decline of roughly 9% earlier this year, and another drawdown of similar size on a blue wave would not surprise us. History also shows that the market has gained an average of 31% in the year following the midterm-year low.
What would a divided government mean for markets? A Republican president paired with a Democratic Congress has historically produced the weakest average annual return of any combination, at 4.9% since 1951.2 That said, recessions, more than election outcomes, tend to drive bear markets, and we don’t see one on the horizon. Earnings prospects remain robust, with the consensus expectation for S&P 500 earnings growth at about 16% in 2027, according to FactSet as of the end of September. Over the long term, stock prices follow earnings.
What a blue wave could change
If Democrats win both chambers, some things aren’t likely to change; trade and foreign policy, for example, are two levers President Trump would still have significant influence over. We would expect, however, that a fully Democratic Congress would quickly begin work on a number of priorities.
First, a Democratic Congress would likely keep pressing to end the war in Iran. War powers resolutions face a likely veto from the President that Democrats would lack the votes to override, so the more meaningful pressure point would be funding, with restrictions attached to must-pass spending bills.
Second, tariffs will certainly be reconsidered. Many would likely remain, but at less punitive levels and aimed at specific industries rather than entire countries. The auto market, and electric vehicles (EVs) in particular, would stay a focus given heavily subsidized Chinese competition.
Third, Democrats would also likely revisit the One Big Beautiful Bill Act (OBBBA), which was expected to narrow the deficit but has instead widened it.3 We don’t expect total spending to fall; both parties like to spend. Priorities could shift, however, with some of the roughly $1.2 trillion currently earmarked for defense redirected toward healthcare given the 10 to 20 million Americans expected to lose coverage over the next eight years due to new provisions in the OBBBA.3
Regulation would likely tighten as well. Banks, which have benefited from sharply lower capital requirements, could face higher ratios again. Lastly, recent environmental rollbacks would likely reverse, with renewed momentum for green energy.
More stringent AI policy is becoming a bipartisan issue
Artificial intelligence (AI) regulation is often viewed as a Democratic priority, but the desire to implement guardrails is becoming increasingly bipartisan. Looking at just the data-center part of the equation, the infrastructure places heavy demands on electricity, water, and land, all of which are hot-button issues at the local level—and some data centers run on gas-fired turbines that many neighbors find noisy. We’d expect more regulation governing future data center build-outs regardless of the outcome. As for oversight in general, some industry leaders have called for federal regulation, which—conveniently—would also serve to raise barriers for newer entrants, which typically compete on price. That layer of regulation is much less certain, as the Trump administration seems to remain committed to not falling behind China in a kind of “AI arms race.”
As for the financial and investment implications, we would describe ourselves as AI skeptics rather than AI bears. We think the AI trade is on solid footing through 2026 and 2027, since much of the spending is already under contract. But in 2028 and beyond, we are less certain that the current capital spending will be sufficiently monetized.
The bigger risk is continued tightened from the Fed
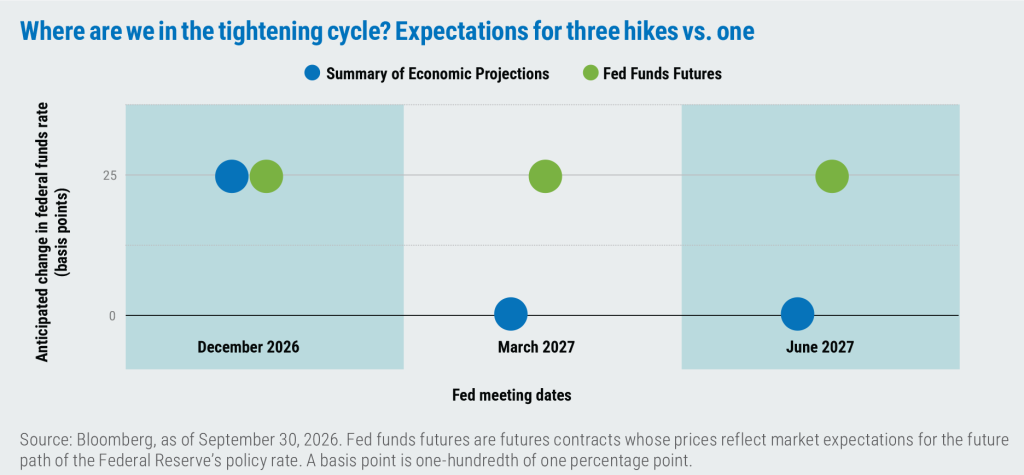
In our view, the Federal Reserve matters more for stock returns than the election does. When the Fed raised rates by 25 basis points in September, its Summary of Economic Projections called for only one more hike this year. History suggests the Fed is rarely one and done. Across the five hiking cycles since 1994, the Fed has raised rates an average of about 10 times, and never fewer than six. Fed funds futures, meanwhile, price in three hikes by mid-2027. We don’t think stocks, and perhaps not bonds, are currently priced for a longer series of hikes, which could prove disruptive for both.
Federal fiscal health and the dollar are the top concerns
The biggest concern is not the composition of Congress going forward, but the compounding effect of higher interest rates on U.S. fiscal health. The deficit is running at about 6% of gross domestic product (GDP), and the Congressional Budget Office projects it will reach 7.1% by 2036. Net interest costs on the U.S. debt, at 3.2% of GDP, now exceed the primary deficit of 2.9%. Treasury Secretary Scott Bessent’s effort to manage the yield curve by buying back long-dated Treasury debt is a short-term fix for a long-run problem.
Proposed $5,000 payments to every American would make matters worse. Estimates suggest they would add about 3.6% of GDP to the deficit, pushing it close to 10%.3 With central banks reducing their Treasury holdings, attracting the next marginal buyer would require higher interest rates, potentially undercutting the policy’s aim.
These pressures also make us long-term bears on the dollar. The combined current account and fiscal deficits exceed 10% of GDP and only the dollar’s status as the world’s reserve currency, which accounts for 88% of international transactions and 57% of central bank reserves, keeps it from being weaker already, in our view.4,5
What to expect after Election Day
Heading into Election Day, we are watching betting markets, which have been among the most accurate indicators. Polymarket currently puts the odds of a Democratic House at over 90% and a Democratic Senate at nearly 70%. While directionally, that feels accurate, we would still treat those odds with some caution: An August analysis found that just 10 wallets accounted for about 17% of Polymarket’s trading volume on congressional races, and that level of concentration can directly impact the platform’s forecasts.6
After the results, we expect a period of headline-driven volatility, particularly if Republicans lose both chambers. If that happens, we wouldn’t be surprised to see stocks trend lower over the short term as investors recalibrate expectations. Once that phase passes, we think the market will be well positioned for continued gains, if history and current earnings expectations are any guide, and investors would do well to refocus on fundamentals once the political dust settles.
- Gallup, average during the month of September 2018.
- Carson Group, as of September 30, 2026.
- Committee for a Responsible Federal Budget, as of September 2026.
- U.S. Federal Reserve, as of September 30, 2026.
- International Monetary Fund, as of September 30, 2026.
- Anti-Corruption Data Collective’s report “Gambling on Democracy,” August 2026.

Boston Partners Global Investors, Inc. (“Boston Partners”) is an investment adviser registered with the SEC under the Investment Advisers Act of 1940. The views expressed in this commentary reflect those of the author as of the date of this commentary. Any such views are subject to change at any time based on market and other conditions and Boston Partners disclaims any responsibility to update such views. Past performance is not an indication of future results.
Discussions of market returns and trends are not intended to be a forecast of future events or returns. You should not assume that investments in the securities identified and discussed were or will be profitable.
Gross domestic product (GDP) is the total market value of all the goods and services produced by a country and is a closely watched reflection of overall economic health. Net interest costs represent the difference between the interest expenses incurred by an entity, such as the government, and the interest income it receives. The S&P 500 Index tracks the performance of the 500 largest companies traded in the United States. It is not possible to invest directly in an index. The Summary of Economic Projections is a report released by the Federal Reserve four times a year, detailing projections from FOMC participants regarding key economic indicators such as GDP growth, unemployment rates, inflation, and the appropriate policy interest rate.
Boston Partners Global Investors, Inc. (Boston Partners) is composed of three divisions, Boston Partners, Boston Partners Private Wealth, and Weiss, Peck & Greer (WPG) Partners, and is an indirect, wholly owned subsidiary of ORIX Corporation of Japan (ORIX).
9201257.1