
Mullaney on the Markets
Powering ahead
By Michael Mullaney | Director of Global Markets Research
Published June 2026
The S&P 500 Index continued to power ahead in May with a return of 5.26% and is now up 11.25% during 2026. The benchmark has hit 22 record closes so far this year, including a whopping 11 in May alone. The S&P has now produced nine consecutive weeks of gains, starting in April—the longest winning streak since December 2023.
Meanwhile, bonds returned just 0.31% for the month as measured by the Bloomberg U.S. Aggregate Bond Index, with coupon income once again needed to offset price losses, as interest rates rose by an average of 9 basis points during the month for Treasury securities with maturities ranging from two to 30 years, a reaction to intensifying inflation pressures. The Agg has returned a paltry 0.38% on a year-to-date basis as investors (via the futures market) have swung from expecting two or three rate cuts by the Federal Reserve to now anticipating one hike by year’s end.
Returns for international stocks, while positive, trailed the S&P 500, with gains of 2.91% for the month and 9.78% for the year as measured by the MSCI World ex-U.S. Index.
Sector returns in May
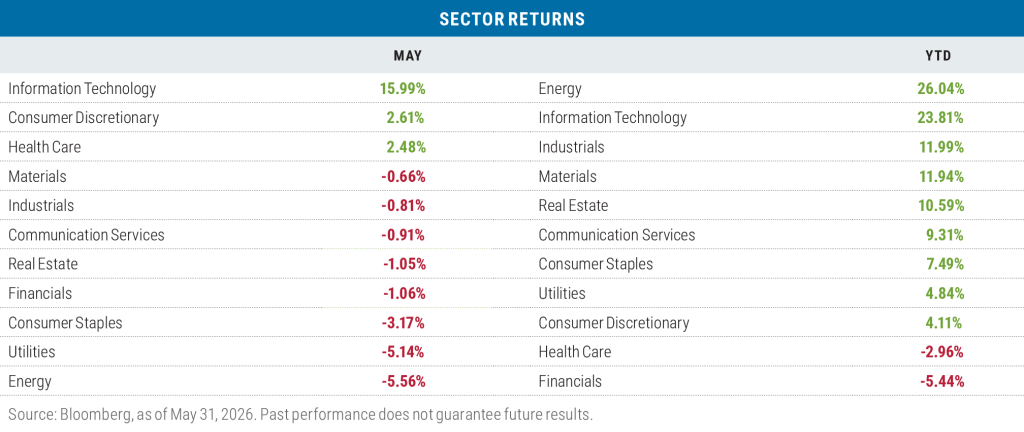
While the S&P 500 posted a strong return during May, it was highly concentrated in just one sector, Information Technology, which at 15.99% returned over six times the next closest sector: Consumer Discretionary, which finished up 2.61%. Only one other sector—Health Care—finished in positive territory.
Within the Technology sector, the gains were fairly broad based, with 51 out of a total of 65 companies (78%) trading above their 200-day moving average. Industrials had the next highest tally at 43, but that is out of 79 names (54%). Technology continued to be a dominant portion of the S&P, representing 39.6% of the index at the end of the month. By contrast, the return of the S&P 500 ex-Technology was a 0.65% decline in May. The effect of this concentration was also notable in that the S&P 500 Equal-Weighted Index returned about half that of the cap-weighted benchmark with a gain of 2.68%.
Dell Technologies led the charge within Tech with an incredible gain of 101.44% during the month, including a one-day gain of 32.8% on May 28 after the company reported a blow-out quarter that included an 88% increase in fiscal Q1 sales versus the prior quarter. Sales for Dell’s server division were nearly double that of a year ago as the company has added over 1,000 new clients for its artificial intelligence (AI) related gear.
The Energy sector pulled up the rear again in May with a loss of 5.56% as the price of West Texas Intermediate (WTI) crude oil closed the month at $87.36 per barrel, down from an intra-month high of $108.66 with the hope that a 60-day peace settlement was within reach, giving the U.S. and Iran time to hammer out the fate of Iran’s enriched uranium and overall nuclear efforts.
Year to date, the Energy sector remains in the lead, with oil prices roughly double what they were at the end of 2025, while the price of regular unleaded gasoline is up more than 50%. Financials are the laggard year to date, as the yield curve has flattened given shifting expectations regarding the Fed’s next move, which investors worry could hinder the net interest margins of banks.
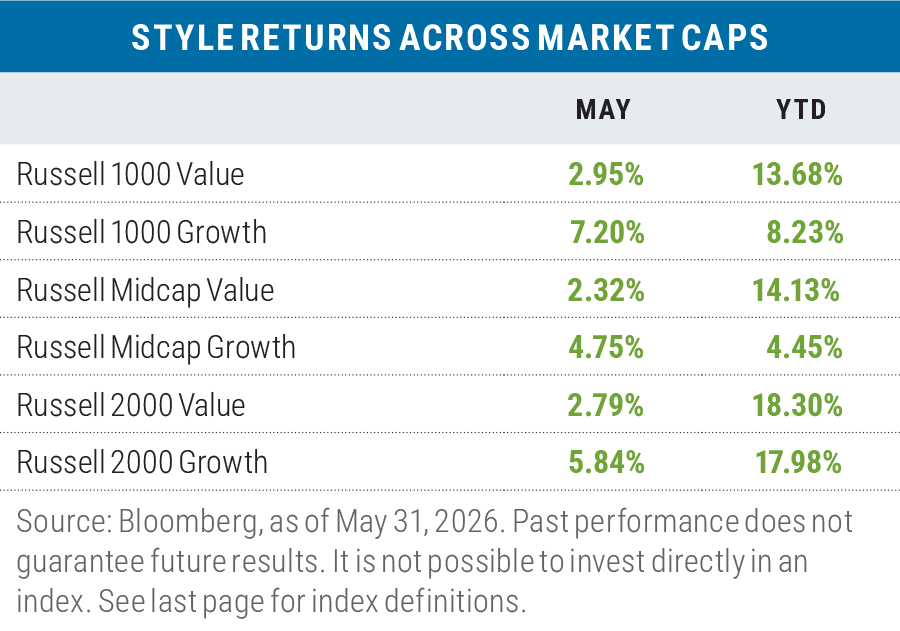
Growth leads in May
Growth outperformed value for a second month in a row by a margin of 3.24% when averaged across the Russell 1000, Russell Midcap, and Russell 2000 indexes, with the Russell 1000 Growth Index posting the strongest absolute and relative performance of the six different style categories.
Of no surprise, the Technology sector was the primary source of strength for the return of the Russell 1000 Growth Index, gaining 12.96% during May and—with a weight of nearly 52% of the overall index—was responsible for over 90% of the index’s returns for the month.
Year to date, value continues its lead over growth across all three capitalization ranges of the Russell benchmarks by an average of 5.51%. In the large-cap space, paradoxically enough, it’s the Technology sector within the Russell 1000 Value Index that is responsible for 91% of its outperformance versus the Russell 1000 Growth Index, with a sector return of 78.09% versus growth’s 13.42%. One stock, Micron Technology, is responsible for 29% of the Tech sector’s return in the Russell 1000 Value Index with a year-to-date gain of 240.37%. The company has benefited from an almost insatiable demand for computer memory related to the AI buildout; Micron specializes in the manufacturing of dynamic random access memory chips (DRAMs), static random access memory chips (SRAMs), and flash memory chips. Micron Technologies is not part of the Russell 1000 Growth Index.
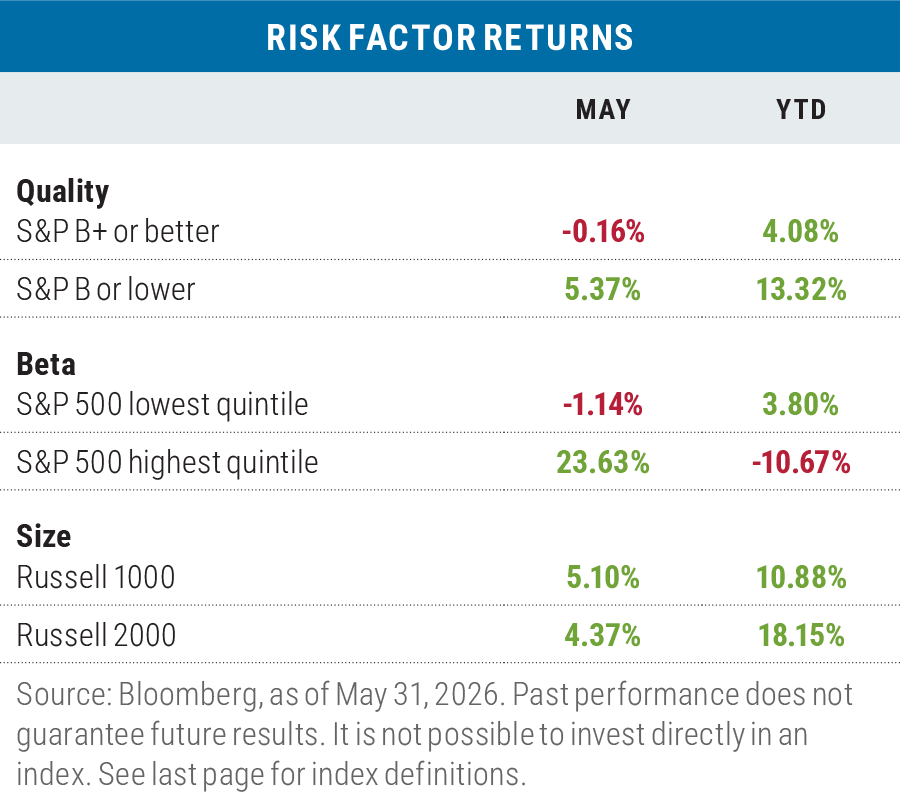
“Risk On” dominates in May
In May, the return spread between the “risk on” factors of low quality versus high quality and high beta versus low beta were greater than usual, particularly for high-beta stocks. The high-to-low beta spread is rooted in the fact that the top 10 performers in the S&P 500 in May had an average beta of 1.89 and produced an average return of 67.8% during the month. All but one of the top 10 (First Solar) were technology stocks.
While the small-cap Russell 2000 Index lagged the large-cap Russell 1000 Index during the month, that was largely due to the outperformance of mega-cap tech stocks like Dell Technologies.
Risk factor returns on a year-to-date basis remain more mixed; while the “risk on” factors of low quality and small size were leaders, high-beta has been a laggard.
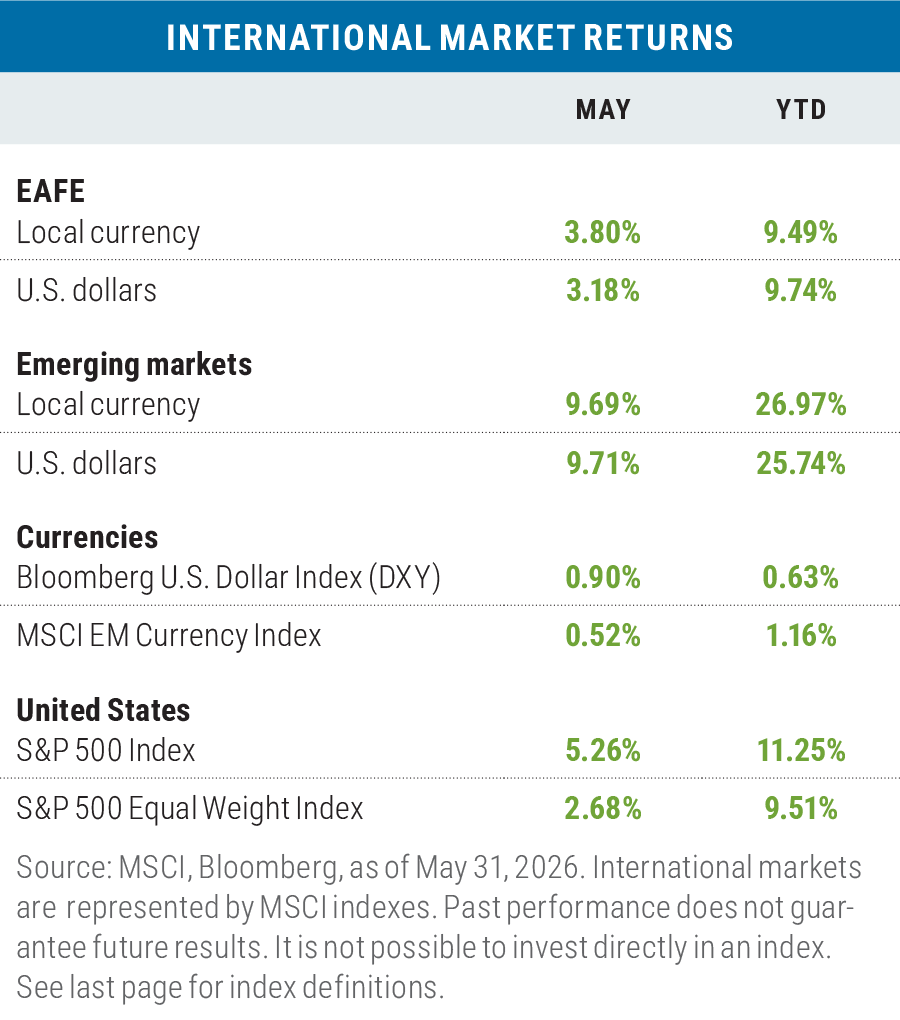
Mixed results for non-U.S. stocks in May
Developed market international stocks, as measured by the MSCI EAFE Index, lagged the S&P 500 in May in both local currency and U.S. dollar (USD) terms, while emerging market stocks beat the S&P 500 on both fronts for a second month. The DXY U.S. dollar index strengthened against a basket of six major foreign currencies, but the USD lagged a basket of MSCI emerging market currencies by 0.52%.
During May, exceptional returns were once again generated in South Korea (up 39.03%) and Taiwan (up 27.82%), as those countries continue to ride the wave of semiconductor demand from the AI buildout.
Year to date, developed market stocks now lag the S&P 500 in local currency and USD terms, while emerging market stocks have beaten the S&P 500 soundly in both local currency and USD terms.
Looking ahead
While this year has delivered no shortage of headwinds for stocks, the challenges have in large part been overshadowed by strong earnings growth and corresponding upward earnings revisions: 85% of the companies in the S&P 500 beat Q1 earnings expectations, the highest tally since Q2 2021 (87%). Entering the quarter, the consensus estimate for earnings growth for the S&P 500 for the period was 13.1%, while the actual results have clocked in at 28.6%. At the sector level, Technology had both the highest percentage of companies reporting earnings above estimates (97%) and the highest earnings growth rate (54.3%) of all eleven sectors comprising the S&P 500.
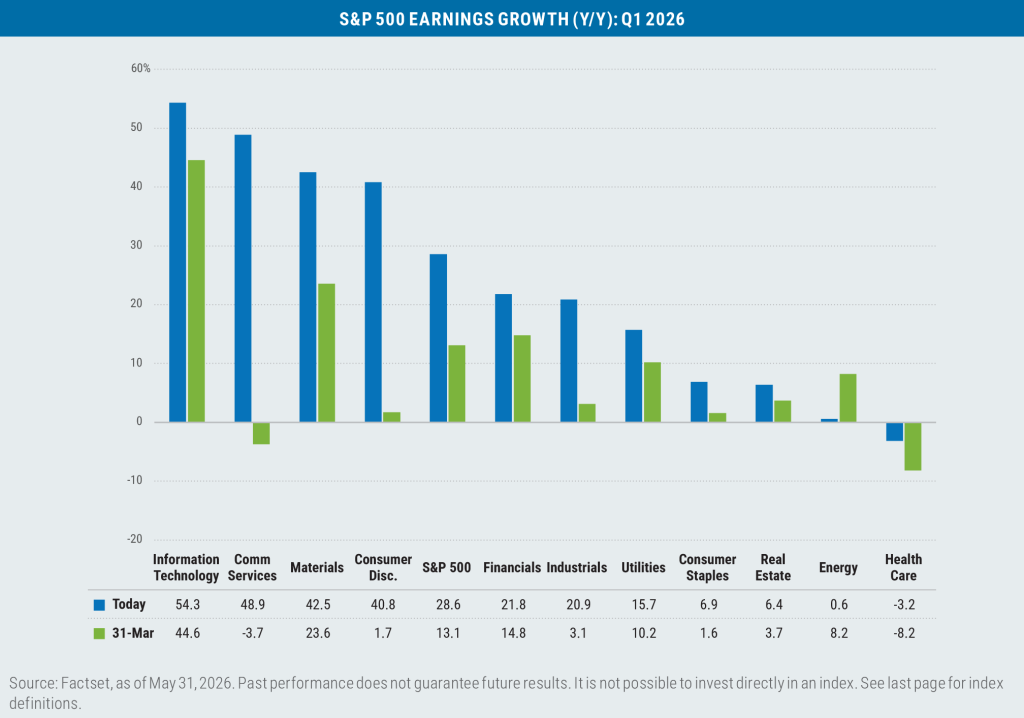
Without the contribution from the Technology sector, the Q1 earnings growth for the S&P 500 would drop to less than 15%—still a very solid number, but one that nonetheless highlights the superlative performance of tech stocks in general.
Within Technology, semiconductor stocks have been on a tear, as the Philadelphia Stock Exchange Semiconductor Index has shot up by 81.13% through the first five months of the year, vastly outpacing the index’s returns for the same period going back to 1998.
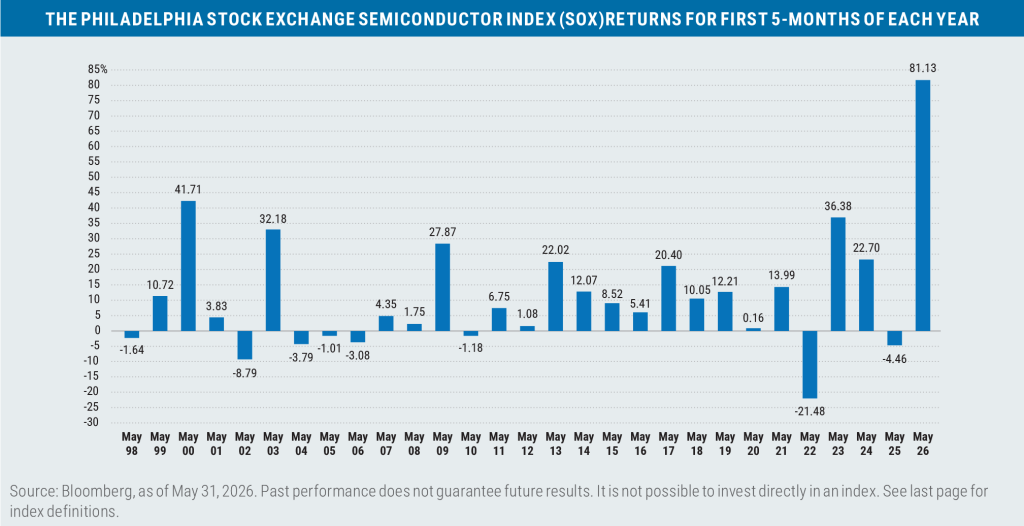
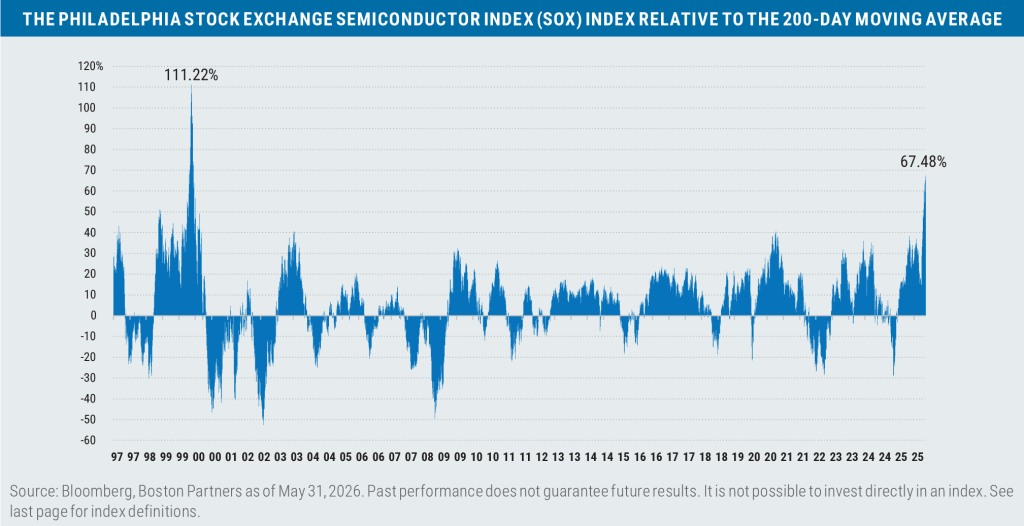
The $64,000 dollar question is whether this kind of performance can continue. Based on history, it may still have room to run, though relative to its 200-day moving average, the SOX Index is indeed traveling in rarefied air.
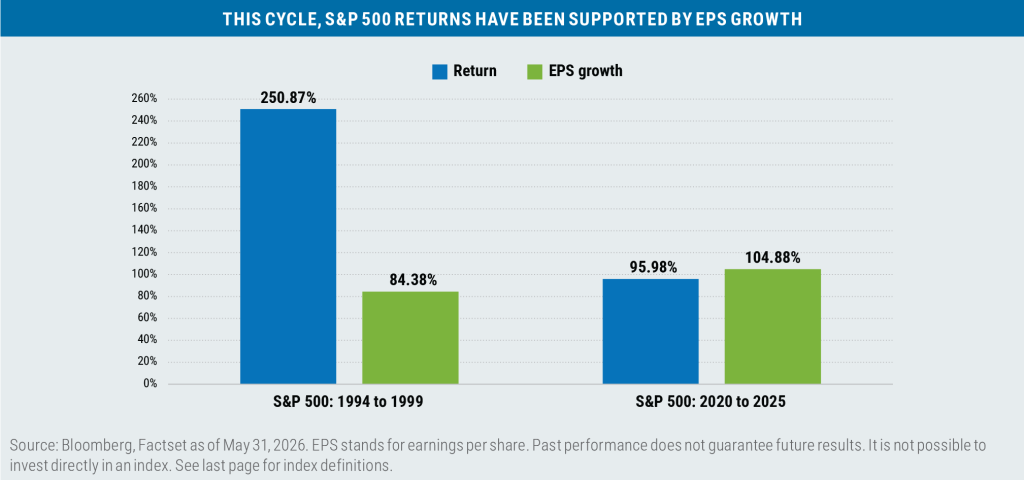
While current valuations and excessive returns may trouble some investors, the “Ghost of 1999” is not necessarily at our doorstep again: While stock returns for the last five years have been unusually strong, they’ve actually been supported by a corresponding level of earnings growth.
While stretched valuations, stubborn inflation, and geopolitical tension remain worrisome, a resilient U.S. economy
and solid earnings growth forecasts should continue to lend support to stock prices, at least over the near- to
intermediate-term.
Lastly, a period of nine consecutive weeks of positive returns for the S&P has only happened nine times since 1958 (the index’s full first year of performance), and has often been followed by additional gains over the following three-month, six-month, and one-year periods.
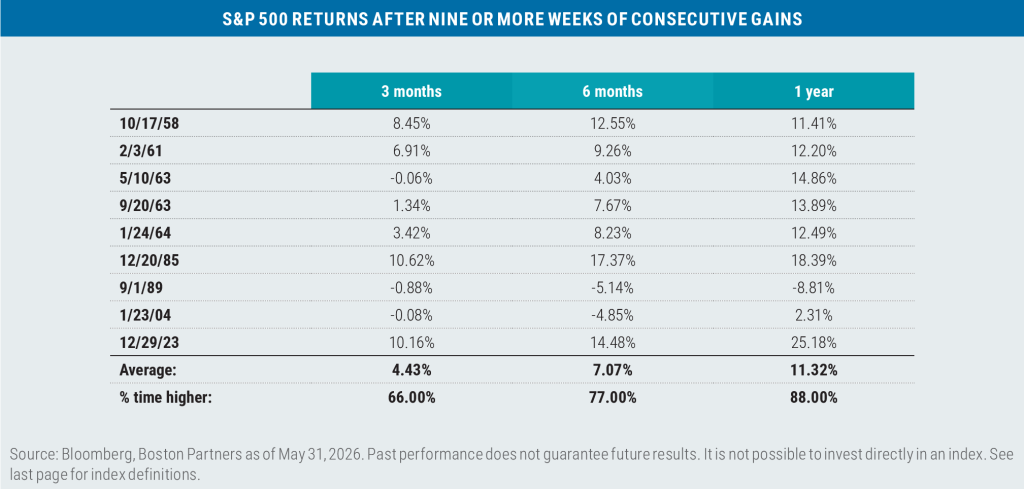
Here’s to hoping that history repeats itself!

Boston Partners Global Investors, Inc. (“Boston Partners”) is an investment adviser registered with the SEC under the Investment Advisers Act of 1940.
The views expressed in this commentary reflect those of the author as of the date of this commentary. Any such views are subject to change at any time based on market and other conditions and Boston Partners disclaims any responsibility to update such views. Past performance is not an indication of future results.
Discussions of securities, market returns, and trends are not intended to be a forecast of future events or returns. You should not assume that investments in the securities identified and discussed were or will be profitable.
Important information
The 200-day moving average is a technical indicator used to determine whether a market is in an uptrend or a downtrend. It is calculated by taking the average closing price of an asset over the past 200 trading days, which helps smooth out short-term price fluctuations and identify longer-term trends. Beta is a measure of a portfolio’s market risk relative to its benchmark. In general, a beta higher than 1.00 indicates a more volatile portfolio and beta lower than 1.00 indicates a less volatile portfolio in relation to its benchmark. Earnings per share (EPS) is a company’s profit allocated to each outstanding share of common stock. The “Ghost of 1999” is an allusion to the Dot-Com Bubble, and the losses that high-flying tech stocks experienced in the early 2000s. Net interest margin is measures the difference between the interest income generated by banks and the interest paid to their depositors, expressed as a percentage of the bank’s interest-earning assets. West Texas Intermediate (WTI) crude is one of the more easily refined types of oil and serves as a key benchmark for oil prices. The yield curve is a graphical representation of how the yields of bonds of various maturities compare.
Index definitions
The Bloomberg U.S. Aggregate Bond Index (Agg) tracks the performance of intermediate-term investment-grade bonds traded in the United States. The Bloomberg U.S. Dollar Index (DXY) is used to measure the value of the dollar against a basket of six foreign currencies. The value of the index is a fair indication of the dollar’s value in global markets. The MSCI Emerging Markets (EM) Currency Index tracks the performance of emerging market currencies relative to the U.S. dollar where the weight of each currency is equal to its country weight in the MSCI Emerging Markets Index. The MSCI EAFE Index tracks the performance of large- and mid-cap equities traded across global developed markets, excluding the United States and Canada. The MSCI Emerging Markets Index tracks the performance of large- and mid-cap equities traded in global emerging markets. The MSCI World ex U.S. Index tracks the performance of large- and mid-cap equities traded across global developed markets, excluding the United States. The Philadelphia Stock Exchange Semiconductor Index (SOX) tracks the capitalization-weighted performance of the 30 largest U.S.-traded companies involved in the design, manufacture, and sale of semiconductors. The Russell 1000 Index tracks the performance of the 1,000 largest companies traded in the United States. The Russell 2000 Index tracks the performance of the 2,000 smallest companies traded in the United States. The Russell 1000 Growth and Value Indexes track the performance of those large-cap U.S. equities in the Russell 1000 Index with growth and value style characteristics, respectively. The Russell 2000 Growth and Value Indexes track the performance of those small-cap U.S. equities in the Russell 2000 Index with growth and value style characteristics, respectively. The Russell Midcap Growth and Value Indexes track the performance of those mid-cap U.S. companies in the Russell 1000 Index with growth and value style characteristics, respectively. The S&P 500 Index tracks the performance of the 500 largest companies traded in the United States.
The S&P 500 Equal Weight Index also tracks the performance of the 500 largest companies traded in the United States, but weights each company equally, rather than proportionally according to market cap. S&P credit ratings, which range from AAA (highest) to D (default), are assigned by S&P Global to individual companies to indicate their relative creditworthiness. It is not possible to invest directly in an index.
Market capitalization breakpoints
The breakpoints for capitalization ranges should be viewed only as guideposts and will change over time. In general, FTSE Russell (which maintains a number of stock-market indexes based on company size) considers small-cap stocks to have market caps of between $150 million and $7 billion, mid caps to have market caps between $7 billion and $150 billion, and large caps to be those companies with market caps above $150 billion.
Boston Partners Global Investors, Inc. (Boston Partners) is composed of three divisions, Boston Partners, Boston Partners Private Wealth, and Weiss, Peck & Greer (WPG) Partners, and is an indirect, wholly owned subsidiary of ORIX Corporation of Japan (ORIX).
8810003.3